Development of a position-sensitive thermal neutron monitor
Introduction
At this moment developed the two-coordinate thermal neutron detector (Monitor), which is designed to visualize a direct passing beam and measure its intensity with minimal neutron flux distortion.
Мonitor settings :
- the size of the sensitive area of the detector is 100 mm × 100 mm
- spatial resolution in both 4 mm coordinates
- operation at neutron flux density up to I=108 n/(сm2sec)
- transmission of thermal neutrons is 95-98%
The advantages of the monitor design:
- Long service life of at least 5 years, which is provided by the use of special technology of manufacturing a package of electrodes
- Extremely low sensitivity to gamma radiation at a level of 10-7-10-8 allows you to measure effectively in conditions of strong gamma background
- Integrability – The monitor can be used as an independent measuring device, and work as part of a measuring system
- Compactness – the thickness of the Monitor along the beam does not exceed 60 mm, i.e. the device can be used in conditions of lack of free space
- The standard recording electronics of neutron detectors, having a relatively low cost, is applicable.
Design andprinciple of operation

The basic design of the Monitor is a multiwire proportional chamber (MWPC), which consists of three electrodes (Fig. 1). In the center there is an anode grid of gilded tungsten wire with a diameter of 15 μm, a step of winding 3 mm. Two cathodes of steel wires with a diameter of 50 μm are located symmetrically with respect to the plane of the anode; the step of winding is 1 mm. The wires of each cathode are united into groups (strips), there are three cathodes in each strip. The strip width w = 3 mm was chosen on the basis of the optimal ratio w / L = 0.8. With this geometry, the differential nonlinearity of the coordinate spectrum will be minimal. To register two coordinates of the electron avalanche, the strips of the cathode planes X and Y are orthogonal to each other. Strip taps are connected to the delay line, which is inside the gas volume. The delay line pitch is τ = 3 ns, and the total number of strips is 35 for each coordinate. Placing the delay line inside the gas volume allows for a qualitative improvement in the signal-to-noise ratio on the preamps compared to the external location.
Feature of electrode manufacturing technology
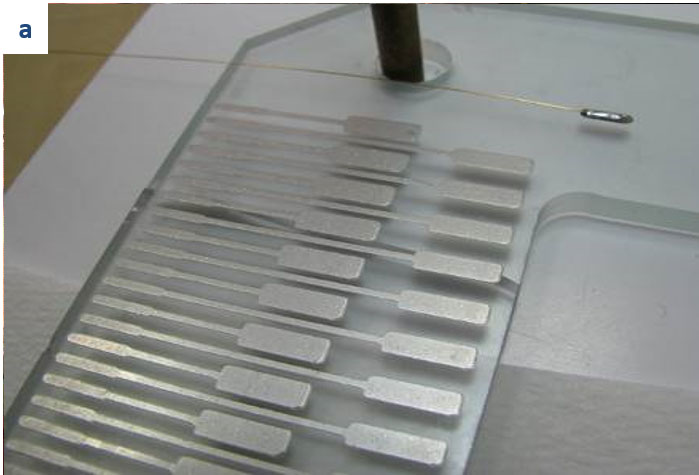
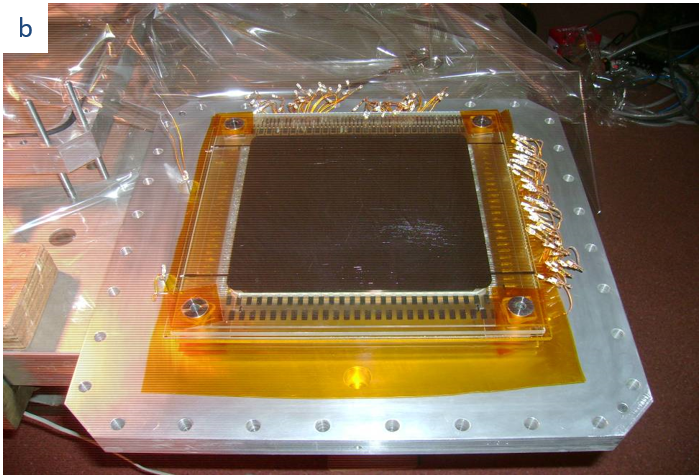
Fig.2 a) Electrode with applied conductive lamellae for soldering wires b) Аssembly of electrodes from glass.
Long-term and stable operation of the Monitor is possible only if the purity of the working gas is maintained. For this purpose, a special technology for the production of detector electrodes from high-purity low-conductivity glass is used. This technology was previously used to create two-coordinate detectors for the Vector and Membran2 diffractometers. It should be noted that today these detectors have worked without refilling the working mixture for more than five years (much longer than the known analogues) and continue to be used successfully. All other structural elements – seals, insulation materials, electrical components inside the gas volume – were examined on a vacuum test bench with a residual gas mass spectrometer and selected in accordance with the minimum gas emission requirement. These technological solutions will minimize the release of gas impurities into the working volume of the Monitor and achieve a longer service life of the device.
The method of removal of signals and recording electronics
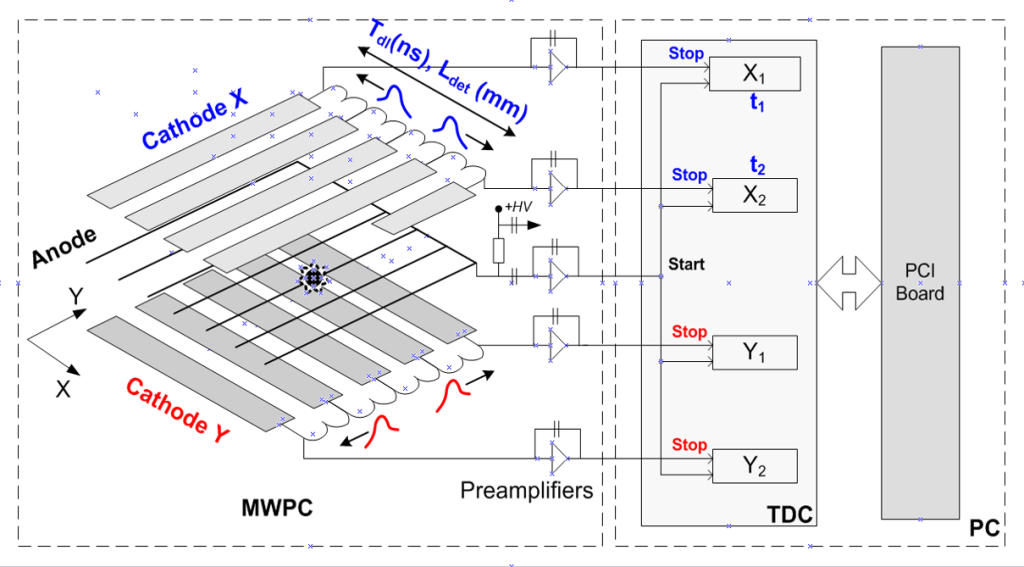
The reaction products of a neutron with a gas converter ionize the working gas mixture, forming a primary ionization track. Primary ionization electrons drift toward the anode and develop an electron avalanche near it. When positive ions move to the cathodes on the strips of the X and Y cathodes, induced signals appear, along the center of gravity of which the event coordinate is determined, fig. 3. from the ends of the delay lines, the signals arrive at charge-sensitive preamplifiers (preamp), which carry out a time reference to the input signal, independent of its amplitude. To minimize the noise level, the input resistance of the preamp Rinput is matched with the characteristic impedance of the delay lines Rdl, and the “electronic cooling” mode is provided. The coordinate of the electron avalanche is calculated from the difference in the arrival times of pulses from the preamp to the corresponding time – code converter:
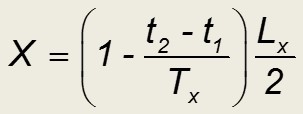
where t1 and t2 are the arrival times of the signals at the delay lines ends, Tx is the length of the delay lines (in ns), Lx is the length of the sensitive region of the detector along the X coordinate. The method used for picking up signals on the delay lines provides the required speed, theoretically limited by the length of the delay lines T ≈100 ns (3ns * 35 strips), with a minimum number of recording channels of electronics. This significantly reduces the cost of the monitor as a whole.
Gas mixture
The monitor can be used in a wide range of neutron flux densities, therefore, there are various gas neutron converters: helium 3He and nitrogen 14N. The conversion of neutrons into charged particles occurs in accordance with nuclear reactions:
3He + n → p + T + 764 keV, (1)
14N + n → p + 14C + 626 keV. (2) 3
He is part of the working gas mixture for registering neutrons 3He is part of the working gas mixture for registering neutrons in beams of relatively low density I ≤ 106 n / (сm2 ⋅ sec). For operation of the monitor with a neutron flux density of I> 106 n / (сm2 ⋅ sec), an application is used as a gas converter, which provides a significant reduction in the efficiency of neutrons, allowing you to work stably under high load conditions without changing its design.

The choice of neutron converter gas pressure
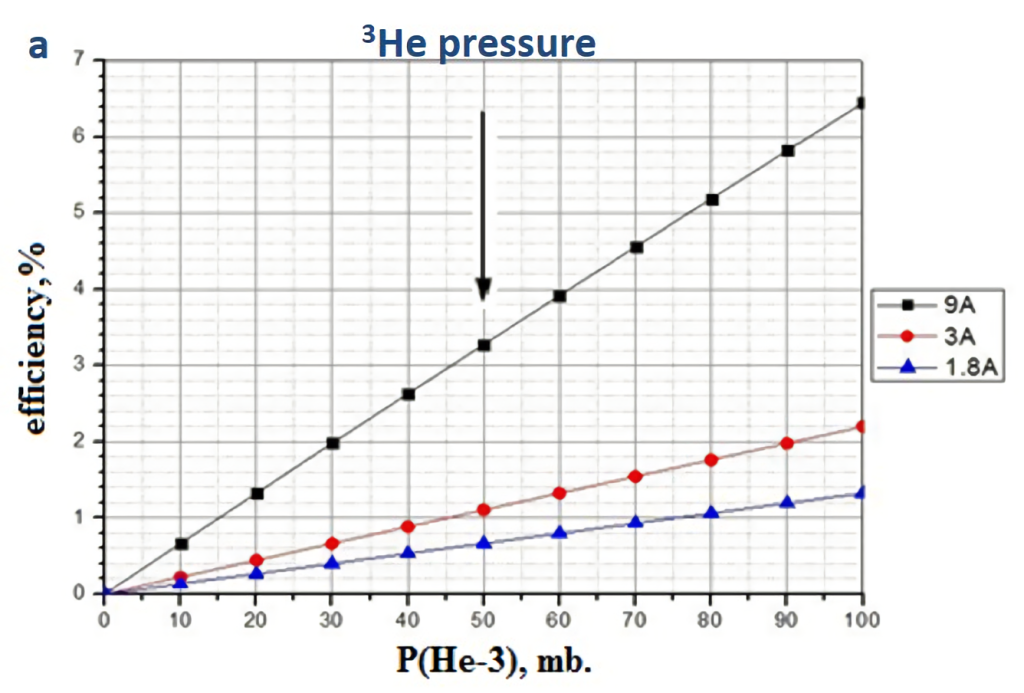
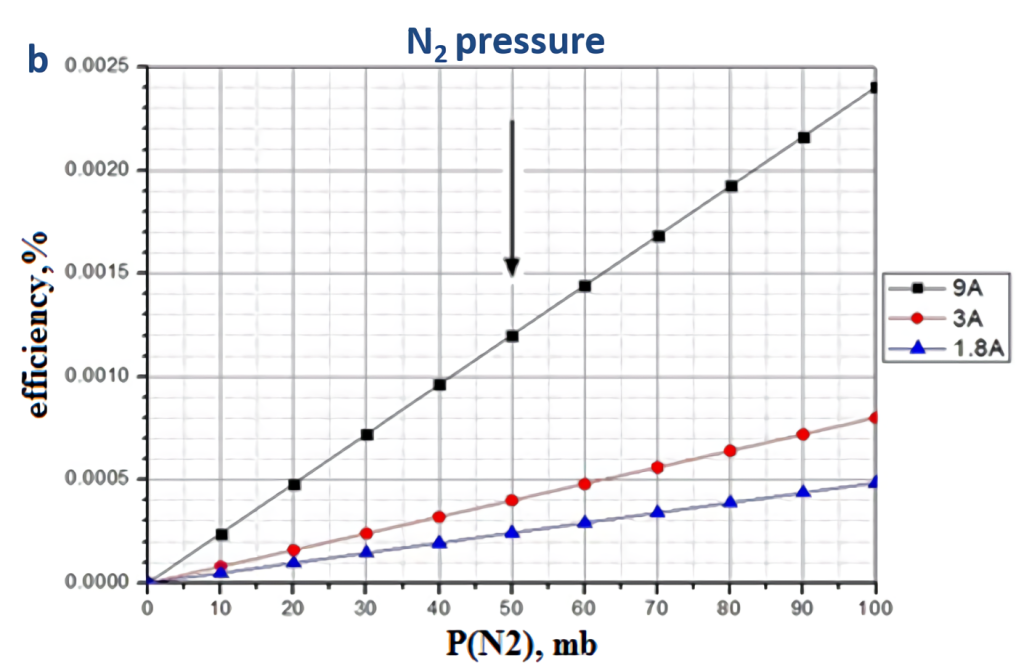
Fig. 5 Registration efficiency of the partial pressure of helium -3 (a) and N2 (b) for wavelengths of 1.8Å, 3Å, 9Å.
There are two solutions for choosing of 3Не partial pressure: 1) adapt the gas mixture to a given wavelength, with a given registration efficiency, 2) create a universal device operating in the specified wavelength range with a level of T≥95%, with efficiency depending on the length the waves. Guided by the idea of the universality of the monitor, we put T≥95% in the whole range λ = 1.8 ÷ 9 Å. Thus, the working gas mixture intended for the monitor to operate at a neutron flux density of I <106 n/(сm2⋅ sec) can have a composition of 1.5% 3He + CF4, while the registration efficiency of the monitor will be ε = 0.15 ÷ 0.75% (λ = 1.8 ÷ 9Å). For operation of the monitor with a flux density of I> 106 n/(сm2⋅ sec) , a gas mixture of 1.5% N2 + СF4 was selected; the registration efficiency is ε = (0.5 ÷ 2.6) × 10-4% (l=1.8÷9 Å), Fig 6 a,b.
Simulations
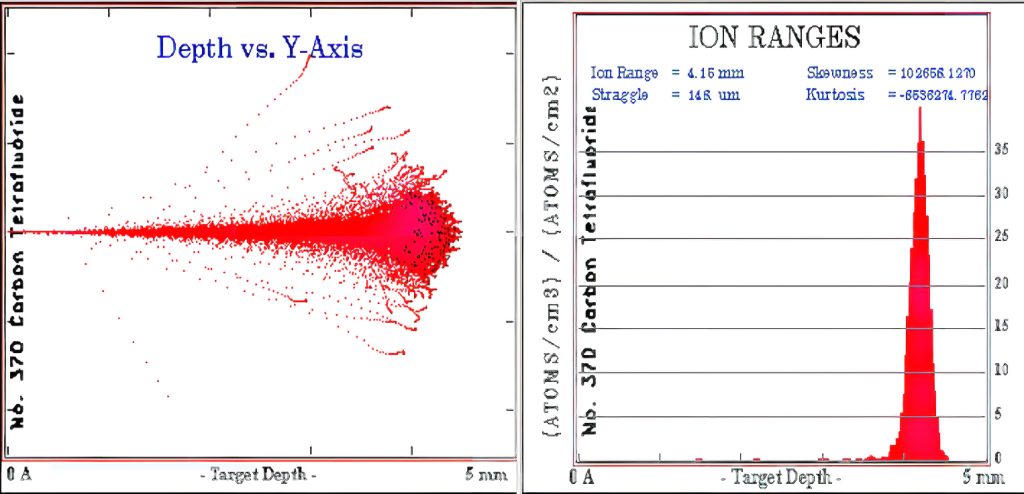
Fig. 7. Calculation of the proton paths in the SRIM program
High voltage operating point:
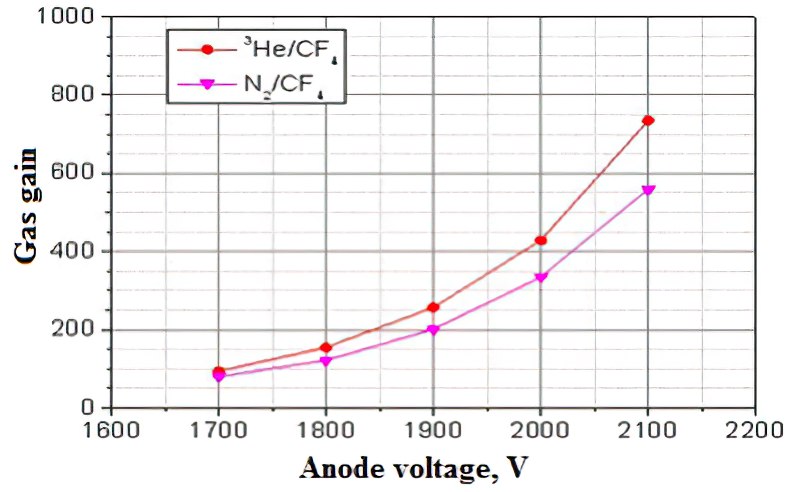
HVa=1900 V (gas gain=250) for 3He/СF4
HVa=1975 V (gas gain=295) for N2/СF4.
Proton run (Ep = 573 keV) in 3Не, N2 и CF4
- Rp(1 аtm. 3Не) = 52.1 mm
- Rp(1 аtm. N2) = 10 mm
- Rp(1 аtm. CF4) = 4.2 mm
Test measurements on a beam with a mixture of 50 mbar 3не+ 950 mbar cf4
Neutron beam characteristics: neutron wavelength: l = 9Å, Dl/l=0.2; the intensity of the incident beam I0: 1.4×10⁴neutron / sec / сm2; useful area: 1cm × 4 cm;
In the course of the research, the amplitude spectra were measured from a counter with the gas mixture under study. View of spectra, fig. 9, corresponds to a typical amplitude spectrum measured on a proportional counter with a 3Не gas neutron converter.
Spectrum structure:
- E=Et+Ep=764 keV
- Ep=3/4E=573 keV
- Et=1/4E=191 keV
- Pedestal – “wall” effect
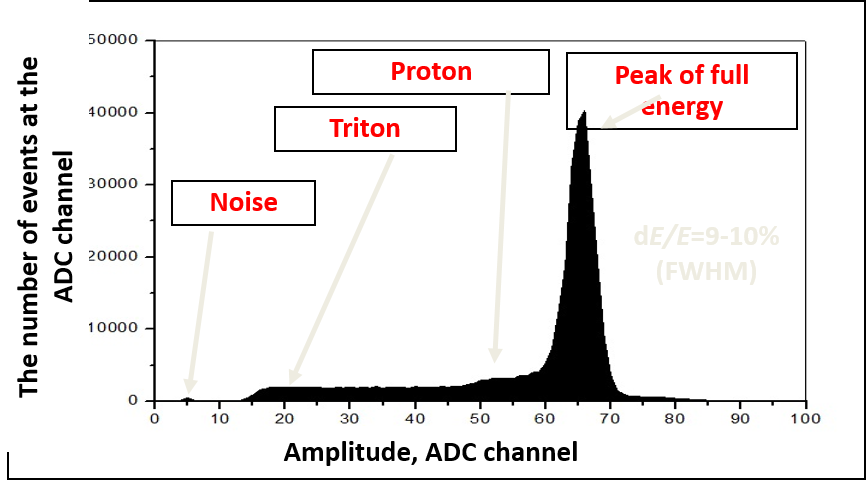

Fig. 9. Dependence of the charge q collected on the anode of the CHM50 counter during the formation of the preamplifier τ = 1 μsec, on the voltage on the anode of HVa.
Fig. 10. Dependence of the gas amplification factor on the voltage at the anode of the proportional SNM-50 counter for the test gas mixture : calculation in Garfield (■) and measurement (●)
Conclusion
- A two-coordinate thermal neutron monitor with an input window of 100 × 100 mm2 was created on the basis of a multi-wire proportional camera.
- To ensure the operation of the Monitor in a wide range of beam intensities, two gas mixtures are proposed for use:
(1)For fluxes I <106 n / cm 2 / sec: 50 mbar 3Не+ 950 mbar CF4, ε = 0.8–3.3% (λ = 1.8–9 Å)
(2)For fluxes I >106 n / cm 2 / sec: 50 mbar N2+ 950 mbar CF4 , ε=(0.2-1.2)*10-3 % (λ=1.8-9 Å) - To ensure a long life of the Monitor without poisoning the working volume with gas evolution products of construction materials, MWPC electrodes are made of ultrapure glass.
- Test measurements were made on a thermal neutron beam. For a mixture of 3Не/CF4, the registration efficiency and gas gain were measured, which are in good agreement with the results of calculations.
- The proposed device can be used in various neutron experiments:
- diffractometry,
- spectroscopy,
- reflectometry
- measurements of beam parameters in real time.
- as a means of detecting and localizing a beam during adjustment of optical systems of experimental installations.
